Interactive & Visual

Drought Devastation

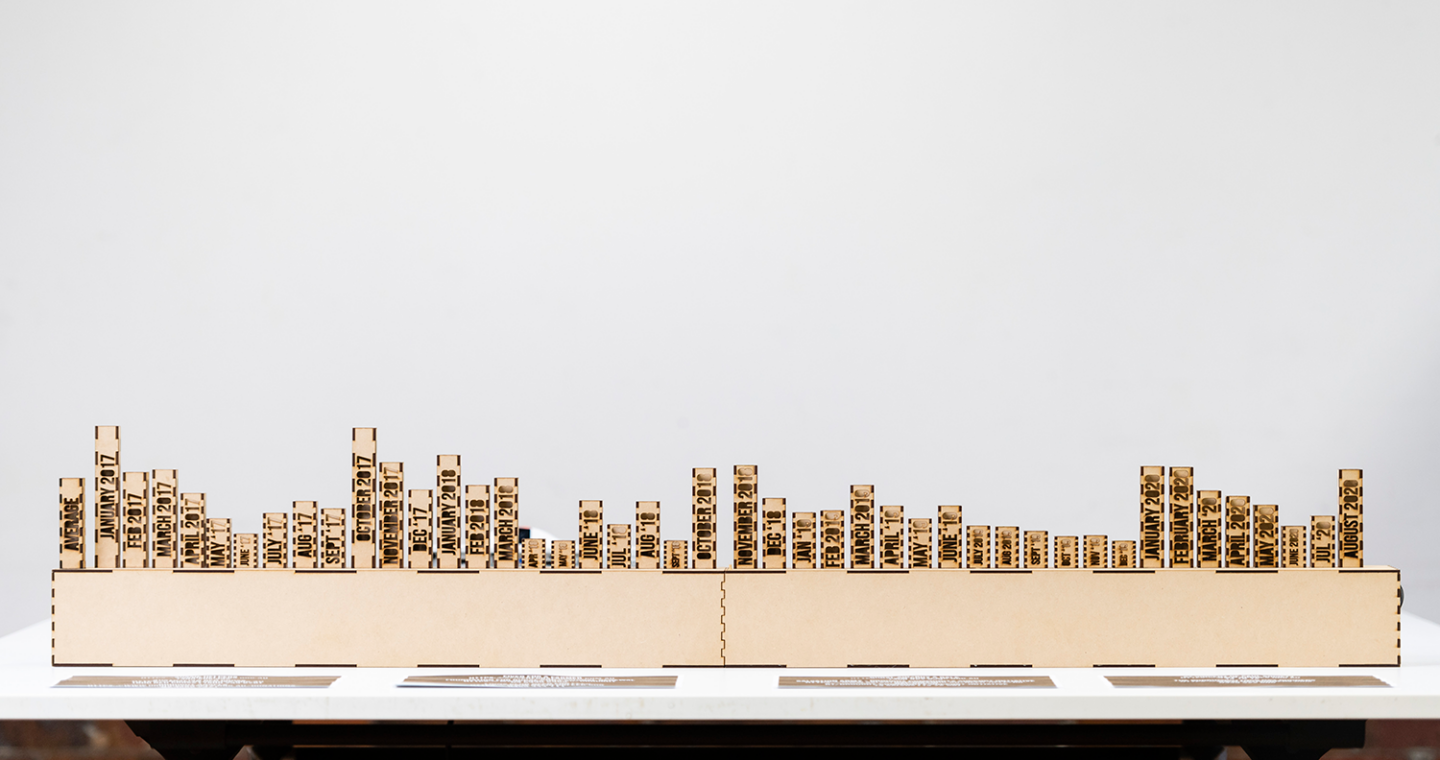
This project aims to design to raise awareness for the importance of social sustainability, by raising awareness for the current Australian drought, which is done by using methods such as data visualization and visual storytelling, creating a visual data story that aims to evoke an emotional reaction from the audience. This physical device displays the average national rainfall for each month from January 2017 to August 2020 (the length of the drought so far) in the form of 3D bar graph columns.

A close-up image of the visual data story columns, which show the rainfall averages across Australia from January 2017, to August 2020.
An image of the complete prototype on display for public use

Thomas Bancroft

Thomas Bancroft is an interactive and visual designer that specialises in tangible interaction, graphic design, and data visualisation, offering creative problem-solving skills and versatility/flexibility in these areas for potential freelance clients and/or potential interactive/graphic design workplaces. Throughout his life, Tom has stood by his values of working hard, and helping people wherever he can. His design aesthetic reflects these values, and they have very much influenced his professional and personal design work.